A recent report has found that while incomes have risen across Perth’s suburbs, some areas have struggled to keep up with the average.

A report by the Committee for Perth has found that while inequality across the city is greater now than almost a decade ago, a recent rise in incomes had been fairly evenly distributed across the suburban area.
The study uses income figures compiled by the Australian Taxation Office for the 2011-12 financial year and analyses the variation in incomes across the city to compile an index of spatial inequality.
The term ‘spatial inequality’ refers to the uneven distribution of resources (and different standards of living/income) within a defined area.
In the report, Perth is divided into 40 statistical local areas, which are used by the Australian Bureau of Statistics for analysing census data.
The index increased from 2005 to 2007, dipped slightly after the GFC and then returned to the 2007 level in 2010, where it has since stayed.
When analysed by postcode, the changes are less pronounced.
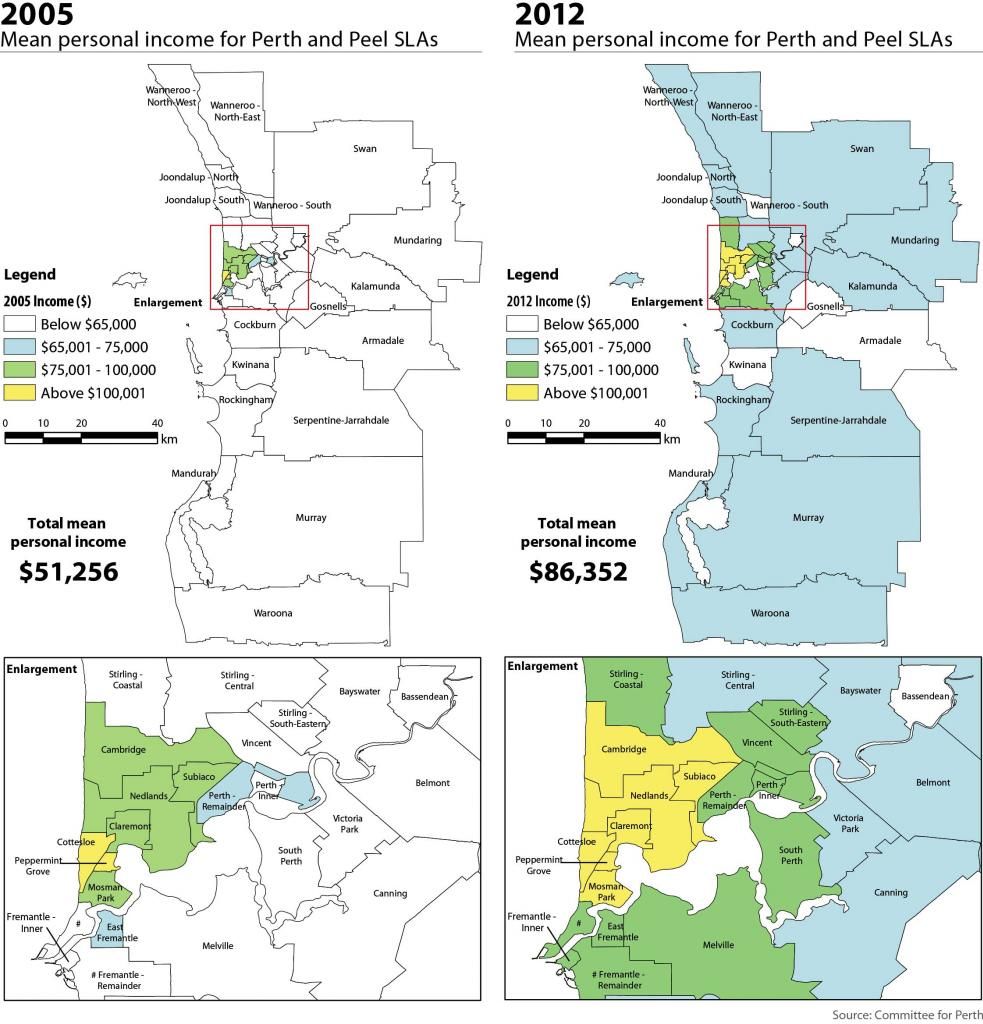
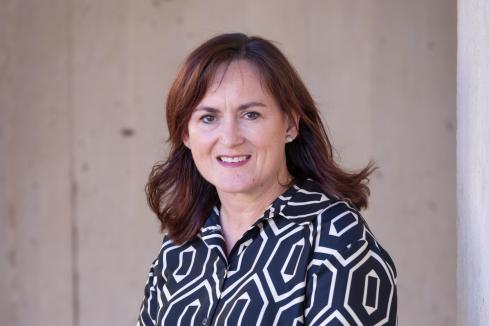
Assistant Professor Kirsten Martinus, from the School of Earth and Environment at The University of Western Australia, found that 28 areas had incomes below the Perth average, two more than in 2005.
“There has been a large increase in incomes,” Assistant Professor Martinus said.
“We’ve gone from the majority (of SLAs) having below $65,000 and just a few above $100,000, to really falling between $65,000 and $75,000.
“The broad stroke is that we’ve seen a rise in the mean income of Perth, so without a doubt all the SLAs have risen, but the relative rise of some compared to others has been greater.”
Accounting for inflation, the average SLA was 13.3 per cent better off over the period, with residents in Melville, Gosnells, Perth (outside the CBD) and south-eastern Stirling fairing worst at less than 10 per cent better off, while Peppermint Grove, Cottesloe and Mosman Park each up around 30 per cent.
This took average income in Peppermint Grove to just under $180,000 annually.
Perth’s poorest areas included southern Wanneroo, Bassendean, Gosnells and Kwinana, each with an average income of between $60,000 and $65,000.
Out of the nation’s five major cities, Perth holds the middle ground.
Sydney and Melbourne have the highest levels of spatial inequality but have fallen slightly over the period, while Adelaide and Brisbane scored lowest.
The finding echoes a recent study by the Melbourne Institute’s Roger Wilkins, who found the top 1 per cent of income earners in Australia earned 7.7 per cent of total income in 2011, compared with 7.5 per cent in 2001.
Mr Wilkins also used tax data to collate the study.
The 2011-12 financial year data also shows that taxpayers in the highest 1 per cent of incomes pay more than 16 per cent of total net tax.